HUMAN: Hate-speech Understanding by Multimodal Attention Network
CS7641 Project proposal: Group 6
DISCLAIMER: The dataset being used for this project contains offensive memes that are racist, sexist, and hateful. This is a trigger warning for the viewer to proceed with caution and take care of their mental well-being and safety.
Introduction
In recent years, the benefits of social media platforms have been masked by the associated harms, including the propagation of hate speech, misinformation and disinformation. It is therefore important to augment the capabilities of human moderators with automation tools to abate these harms.
Multimodal hate speech detection has been relatively less explored problem, owing to the low dataset resources in this area. With the increase in annotated multimodal data in the recent years, however, this problem has become more feasible to tackle. In our work we propose to design, develop and evaluate a multimodal deep learning model to identify memes containing hate speech.
Problem Definition
The problem of hate speech extends beyond a single modality but very few works attempt to solve this problem. The low-research in this field has been due to the lack of data in this problem area. The release of Hateful Memes Challenge Dataset [1], however, sparked an interest in this field and enabled researchers to build models to solve this problem [2, 3, 4]. These models are still far from achieving human-level performance. One main reason is that not enough research has been done to understand the reason behind a model giving false predictions. Moreover, these models use the base pretrained embedding models and do not explore the benefits of transferring the knowledge of base deep learning models pre-trained to understand hate speech in unimodal data. In our work, we propose to overcome these two limitations by understanding the reason behind a model’s predictions by mapping the attention distributions and using deep learning models pre-trained on hate speech datasets [5].
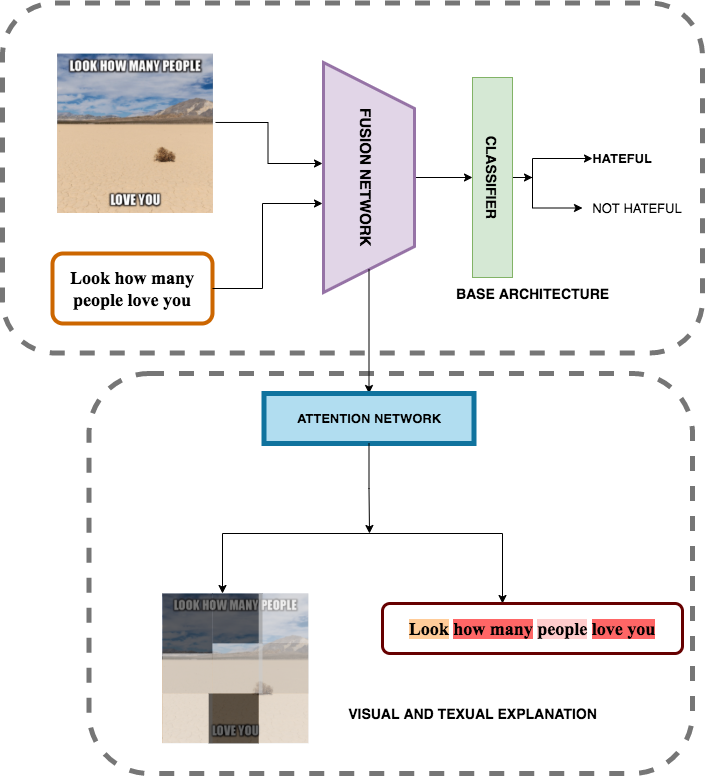
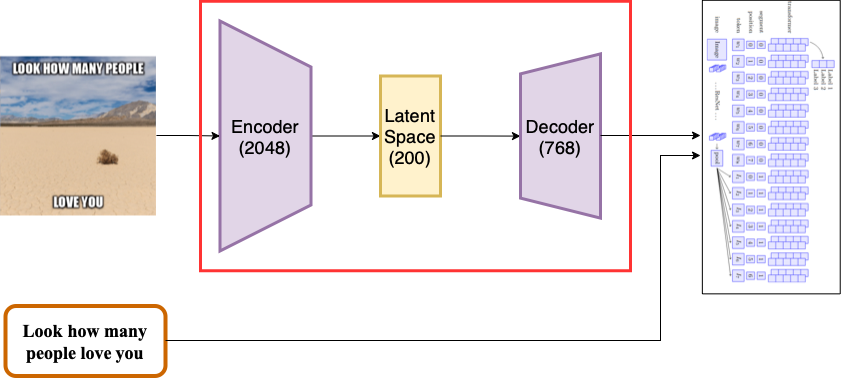
- Figure 1 explains the general architecture of our multi-modal model to classify an input meme as hateful or not.
- We aim to analyze the shortcomings of the SoTA by exploring visual and textual visualization techniques (as shown in the model architecture) by creating clusters of negative predictions and understanding the similarities between the false predictions lying in the same cluster, and decipher if there are particular words or image features which are causing the model to predict a false positive or a false negative for that cluster.
- We hypothesize to transfer the knowledge of hateful texts from textual data sets [6] to the DL model using fine-tuning methods, and evaluate how the model performs, especially on the samples which contain offensive text but were mis-classified as not hateful by the original model.
Progress of the Project:
We have been succesful in accomplishing the following tasks for our project. The details about each task will be explained in further sections.
- Data analysis and preprocessing.
- Feature extraction of the dataset.
- Feature engineering using PCA (unsupervised learning) and related analysis.
- Base line model (supervised) implementation
- Qualitative and Quantitative analysis of the baseline model
- Improvement of the baseline architecture
- Results and Discussion
Data Collection
The first step towards our goal was to understand the dataset, verify if it needed cleaning, and carry out the necessary preprocessing steps. Our task is to create a binary classification model which classifies every meme as hateful (class 1) or non-hateful (class 0). Hateful Memes Challenge Dataset comprises the following files:
- A directory of images containing all memes (png format).
- Line separated json files containing meme’s caption in text and target label of the image.
The json files have been further divided into test, train, and development datasets. Before training our models on this data, we conducted extensive experiments on the dataset like viewing randomly sampled data points, extracting ResNet-152 features [7] of the images, and computing the balance of the dataset. These experiments have been further explained in the next section.
Data Analytics
Trigger Warning!!
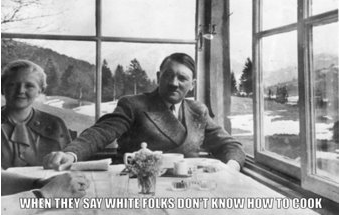
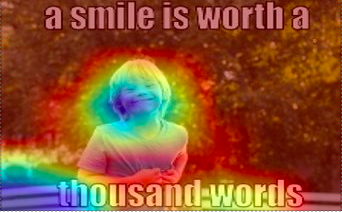
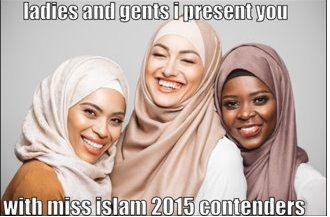
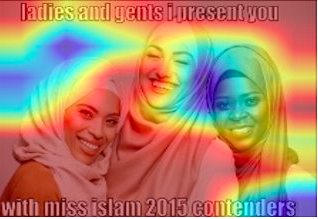
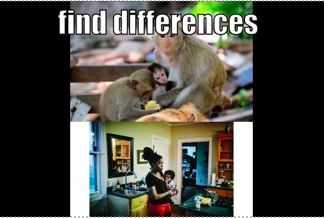
Viewing Sampled Datapoints
Randomly sampled images representing the kind of dataset we are dealing with are shown in Figure 2.

Size and balance of the dataset
The percentage split of the data in the train, test, and development is shown in Figure 3 below:
| Dataset | No. of images |
|---|---|
| Train | 8500 |
| Dev | 1040 |
| Test | 3000 |
In order to rule out the possibility of unreliable results, we checked the balance of the dataset. The total number of images that are labeled as non-hateful is 7634 whereas the number of images labeled as hateful is 4506. So the dataset is not skewed and can be used as-is for good results.
Methods
Data Preprocessing
This section explores the process of feature extraction and the challenges faced while accomplishing that task:
Feature extraction
We have utilized the ResNet-152 model pretrained on the publicly available imagenet dataset for carrying out feature extraction. Before feature extraction, the following steps were undertaken as a part of preprocessing the dataset:
- The dataset consists of images with various modes including RGB, RGBA, and CMYK. Since the feature extractor (ResNet-152) expects consistency in input modes, we unified the image modes for the entire dataset. Every image was converted into a 3 channel RGB scale.
- The images in the dataset had inconsistencies in their dimensions. We resized the images and used the center crop to make all the images uniform.
- All the images were normalized in mini-batches of 3-channel RGB images of shape (3 x H x W), where H and W are expected to be at least 224. The images were normalized using the mean = [0.485, 0.456, 0.406] and std = [0.229, 0.224, 0.225].
- As the final step, we used the weighted product of the input image at the penultimate layer of the ResNet-152 model as the features of our dataset. This way we obtained a total of 2048 features per image.
Feature Engineering/Dimensionality Reduction using Unsupervised Learning
As mentioned in the previous section, we extract the feature maps for images in the Hateful Memes dataset using a pre-trained ResNet-152 model, transforming each image I ε R HXW to feature map V ε R D, where D=2048. We analyze the performance of a simple neural network i.e a fully-connected linear classifier in detecting a meme as hateful/ non-hateful. Our model inputs an image feature vector V and outputs a logit ε {0,1}. Instead of using the binary cross-entropy loss function combined with the sigmoid function, we employ binary cross-entropy with logits loss. The latter is numerically more stable, which in turn leads to better results. Further, our model incorporates an adam optimizer instead of SGD as it can handle sparse gradients on noisy problems.
The motivation behind building this simplistic model was to analyze the “curse of dimensionality”. We employ Principle Component Analysis to examine if an image can be represented with a feature vector v ε R d such that d«D. Our intention is to represent an image with the most salient features that are essential for determining if an input image is hateful or not.
Ablation Analysis
We use 9104 image samples to train our neural network model and we evaluate its performance on 3035 data samples. We perform an ablative study and analyze the performance of our model as we reduce the number of features using PCA.
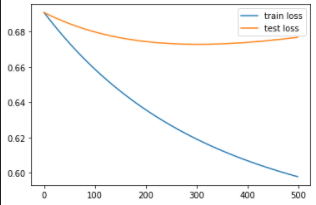
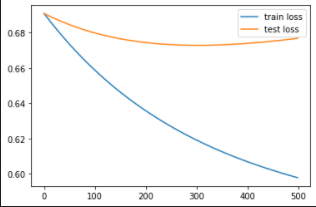
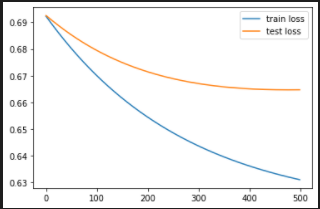
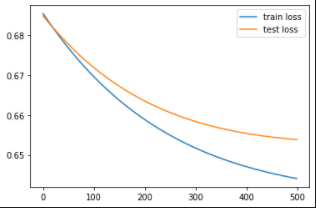
We first train our neural network model for 500 epochs with the original number of image features, d=2048, and observe the change in training and testing loss with every epoch.
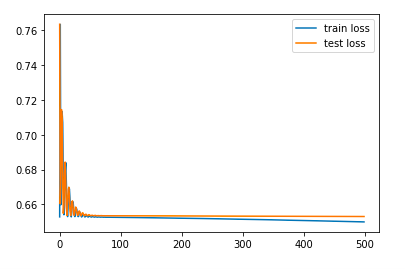
We employ PCA to reduce the number of image features to d=1000, d=500, d= 200, d=100. For all the scenarios, we observe the change in the Train and Test loss with every epoch as shown in figure .
| d=1500 | d=1000 |
|---|---|
 |
 |
| d=500 | d=200 |
|---|---|
 |
 |
We also record the Train and Test accuracy as we reduce the number of dimentions as shown in the table below:
| Number of Image features: d | Test Accuracy(%) | Train Accuracy(%) |
|---|---|---|
| 2048 (original) | 62.80 | 62.90 |
| 1500 | 58.78 | 69.16 |
| 1000 | 58.97 | 67.45 |
| 500 | 61.02 | 65.80 |
| 200 | 63.16 | 63.38 |
Feature Selection
We first observe degradation in the performance of our NN model when we reduce the number of features from 2048 to 1500 using PCA. But as we further decrease the feature dimensions, we see a significant improvement in performance. In fact, for d=200, we beat the performance of our model with original features. Hence, with PCA we are able to obtain a better representation of the input image. Moreover, these 200 image features to capture more useful information as compared to 2048 features due to which our model is able to classify hateful memes with better accuracy. By performing this experiment, we successfully determine the most salient image features that can be fed into our multimodal baseline for hateful memes classification discussed in the next section.
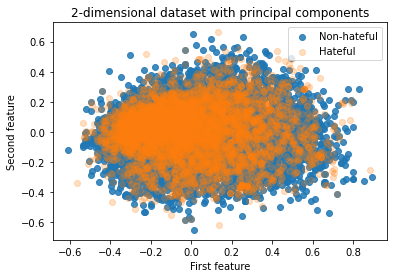
PCA Visualization
We analyze the performance of PCA by projecting 2048 image features onto 2 dimensions. We observe that 2 features are not sufficient enough for capturing useful information required for classifying a meme as hateful/non-hateful. Unfortunately, it is not feasible to visualize the performance of PCA with 200 features with which we obtain promising results.
Baseline Model for Hateful Memes Classification using Supervised Learning
MultiModal BiTransformers
The feature engineering study provided us with convincing initial results to understand the number of features to be used for generating our meme’s image embedding and helped us draw the initial conclusion that a ResNet-152 architecture can work in practice for this task. As we discussed previously, the task at hand, however, is multimodal in nature and in this section we explore the implementation details and initial results of a multimodal baseline architecture, which we will improve upon using the results of our feature engineering study, and will allow us to quantify the improvement.
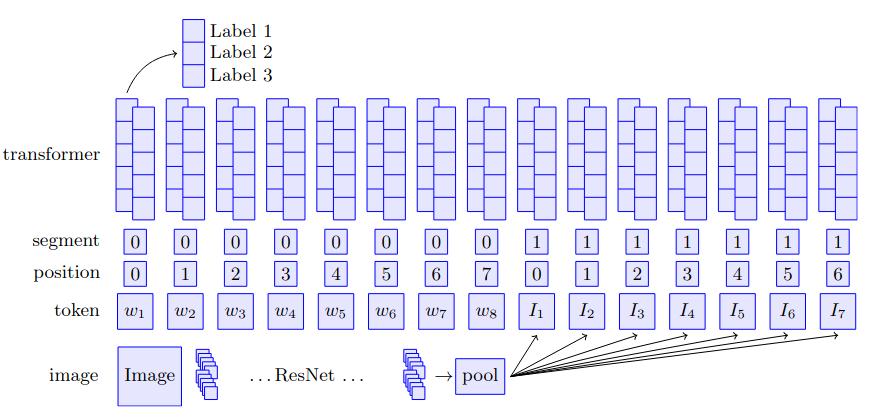
Building on the intuition of our proposed HUMAN architecture (Figure 1), we combined the ResNet-152 architecture [7] with the BERT textual embeddings [8] with the help of the supervised MultiModal BiTransformer (MMBT) model [9] and formed our initial multimodal baseline. The choice of this architecture was made due to the fact that this model gives a competitive accuracy performance as compared to the various other SoTA models like ViLBERT [10] and VisualBERT [11], while being much simpler and adaptable to fine-tuning and improvement through unimodal models (since MMBT does not require multimodal pretraining and can use unimodal pretraining).
As shown in figure 7, the MMBT model obtains the image embedding using the weights of a pretrained ResNet-152 model [7], and applies a linear transformation to project this image embedding onto a text embedding space which is initialized with the pre-trained base-uncased BERT model [8]. The segments (as shown in the figure), further help distinguish between the two modalities, while position maintains the count of the words and images (where the number of words is equivalent to the number of words in the meme and the number of images is equal to the output of the average pooling of the final layer of the ResNet-152 architecture). Each word is a vector of 768 dimensions while the dimension of each image (where each image is generated from the single input image and is actually the result of using corresponding number of filters) is 2048 which is projected to the word token space of 768 dimensions.
Implementation Details
We implemented this multimodal baseline model with the help of the MMF framework [12] using the Google Colab as our compute environment. This provided us with a Tesla P100 GPU with 16GB RAM and we used a batch size of 32 which was sufficient to fit in the GPU memory. We used the pretrained base-uncased BERT model to generate our text embeddings of 768 dimensions and the pretrained ResNet-152 model to generate our input image embeddings of 2048 dimensions. We then use a fully connected linear layer with input dimensions equal to the sum of the number of words and number of images and output dimension of 2, to distinguish between the hateful and non-hateful classes. Moreover, we use the Binary Cross Entropy Loss as our loss function, tanh as our activation function and the Adam Optimizer with a learning rate of 10-5 and epsilon value (stability constant) value of 10-8. We report the binary accuracy, F1 score and Area under the ROC curve on our validation set as our evaluation metrics and also observe the decrease in the training loss to understand if the model was training or not. We also used a dropout layer of value 0.1 to prevent overfitting of the model.
Qualitative Analysis of the baseline model
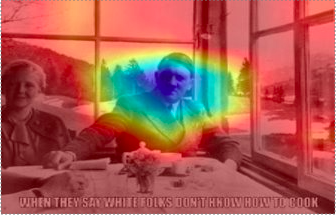
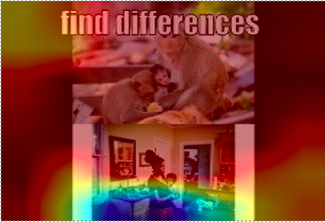
We employ GRADCAM to evaluate the performance of the baseline MMBT model. GRADCAM[13] uses the class-specific gradient information flowing into the penultimate convolutional layer of a CNN-based model to generate a localization map which highlights salient regions of the input image. In order to understand the prediction of the MMBT model, we generate GRAD-CAM heatmaps for true positive, true negative, false positive and false negative outcomes as shown in the figure below. As can be seen from the examples, the instances where the model gives accurate prediction, the focus of the heatmap is on the right regions of the image. However in cases of false positives and false negatives the focus goes haywire. These examples give us intuitions of why the model does not perform well on such instances.
| True Positive | GT: Hateful, Prediction: Hateful |
|---|---|
 |
 |
| True Negative | GT: Non-Hateful, Prediction: Non-Hateful |
|---|---|
 |
 |
| False Positive | GT: Non-Hateful, Prediction: Hateful |
|---|---|
 |
 |
| False Negative | GT: Hateful, Prediction: Non-Hateful |
|---|---|
 |
 |
Quantitave Analysis of the baseline model
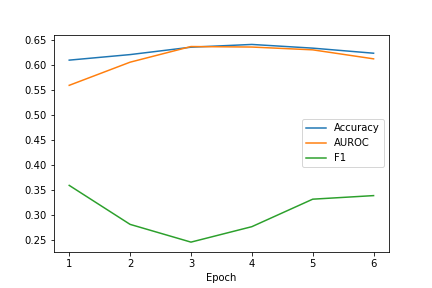
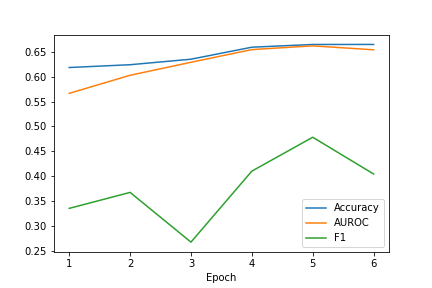
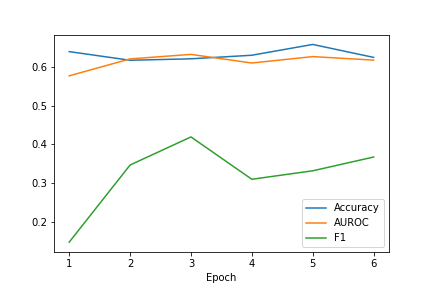
Through our implementation, we were able to replicate the baseline results presented in the challenge introduction paper [1] as we achieved a validation accuracy of 0.6204, validation F1 score of 0.3366, validation AUROC of 0.6129 and a test accuracy, F1 score and AUROC of 0.6505, 0.3017 and 0.6424 respectively. Further, figure 8 shows the change in performance of the model with the increase in the number of epochs. Through this we observe that the model performance is not improving much across epoch values. As a next step, we will work to improve this model further so that the model performance is improved across the various epoch values. Next, we will also be using only the 200 important features found using PCA and do an ablation analysis with the unimodal models to observe strengths and weaknesses of using a multimodal model over the unimodal models.
Improving the baseline model
We employ various methods discussed in the class to improve the baseline. We explain the intuition behind each enhancement made in the architecture and quantitavely evaluate the performance of the improved architecture.
MMBT-R:
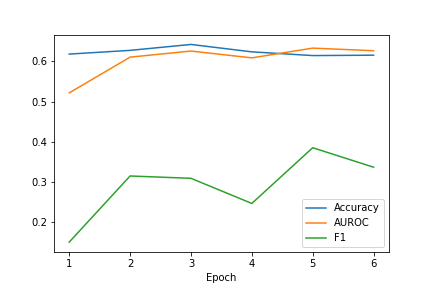
MMBT-Reduced employs an encoder to obtain a better representation of input image. An Image I ε R D where D=2048 is transformed into i ε R d where d=200. The intuition behind this change has been explained in the earlier section, where we employed PCA and realised that an input image I can be better represented with 200 priciple features. Using this intuition, we were able to improve the performance of our baseline model in terms of accuracy, F1 score and AUROC as shown in table 2.
MMBT-L2:
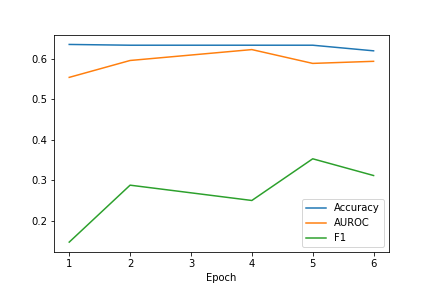
MMBT-L2 employs an improved optimizer that increases generalizability of the model. As studied in class, regularization parameter λ drives the bias of an ML model. We increase the weight decay of the adam optimizer from 0.01 to 0.1 which is equivalent to increasing L2-regularization, and we evaluate the performance of this change in terms of the same metrics- accuracy, F1 score and AUROC a shown in the table 2.
MMBT-D:
As DL models suffer from the curse of dimentionality, we employ one of the popular techniques to increase the generalizibility of our model- “Dropout”. MMBT-D randomly discards 40% of the neurons as compared to the 10% dropout probability in the baseline. This means that these neurons are ignored while updating the weights during the forward pass and the backward pass.
MMBT-WC:
The original model simply concatenates visual and texual embeddings before transformer self-attention layer. MMBT-WC employs weighted concatenation in which the weights are learnable parameters. The intuition behind carrying out this experiment was that we believed both the modalities do not contribute equally to the predicted output and hence, we tried learning the contribution of each modality.
Results and Discussion
Table 2 illustrates the performance of all our models as compared to the baseline model MMBT. We evaluated all the models on three metrics accuracy, F1 score and area under the ROC curve. The MMBT-R model i.e. the MMBT model with reduced image dimensions achieves the best performance on all three evaluation metrics. The regularized MMBT model also improves on the baseline across all three metrics which confirms the lessons learnt in class that increase the regularization increases the generalizability of a machine learning model. We tried to improve further on this intuition of generalizability by increasing the dropout probability from 10% to 40% but found that this in fact dropped some of the important neurons and hence decreased the model performance. Finally, we also tried a better concatenation of the two modalities in an attempt to improve the model architecture further. We found that this learned weighted concatenation did improve the precision and recall but also added some noise which led to a decrease in performance. In conclusion, through our work, we were able to understand the benefits of dimensionality reduction, regularization and understood the reason of performance of our MMBT model
| Model | Accuracy(%) | F1 | AUROC |
|---|---|---|---|
| MMBT-base | 0.650 | 0.301 | 0.642 |
| MMBT-R | 0.662 | 0.482 | 0.688 |
| MMBT-L2 | 0.659 | 0.466 | 0.680 |
| MMBT-D | 0.642 | 0.294 | 0.664 |
| MMBt-WC | 0.641 | 0.467 | 0.650 |
Table 2
| MMBT-R | MMBT-L2 |
|---|---|
 |
 |
| MMBT-D | MMBT-WC |
|---|---|
 |
 |
References
[1] Kiela, D., Firooz, H., Mohan, A., Goswami, V., Singh, A., Ringshia, P., and Testuggine, D., “The hateful memes challenge: Detecting hate speech in multimodal memes,” arXiv preprint arXiv:2005.04790 (2020).
[2] Zhu, R., “Enhance multimodal transformer with external label and in-domain pretrain: Hateful meme challenge winning solution,” arXiv preprint arXiv:2012.08290 (2020).
[3] Muennigho, N., “Vilio: State-of-the-art visio-linguistic models applied to hateful memes,” arXiv preprint arXiv:2012.07788 (2020).
[4] Velioglu, R. and Rose, J., “Detecting hate speech in memes using multimodal deep learning approaches: Prize-winning solution to hateful memes challenge,” arXiv preprint arXiv:2012.12975 (2020).
[5] https://huggingface.co/Hate-speech-CNERG/dehatebert-mono-english
[6] Mathew, B., Saha, P., Yimam, S. M., Biemann, C., Goyal, P., and Mukherjee, A., “Hatexplain: A benchmark dataset for explainable hate speech detection,” arXiv preprint arXiv:2012.10289 (2020).
[7] Kaiming H., Xiangyu Z., Shaoqing R., Jian S., “Deep Residual Learning for Image Recognition” Proceedings of the IEEE conference on computer vision and pattern recognition. 2016.
[8] Devlin J., Chang M.W., Lee K., Toutanova K., “BERT: Pre-training of Deep Bidirectional Transformers for Language Understanding” arXiv preprint arXiv:1810.04805.2018.
[9] Kiela, D., Bhooshan, S, Firooz, H., Perez, E., Testuggine, D., “Supervised multimodal bitransformers for classifying images and text” arXiv preprint arXiv:1909.02950. 2019.
[10] Lu, J., Batra, D., Parikh, D., Lee, S. “Vilbert: Pretraining task-agnostic visiolinguistic representations for vision-and-language tasks” arXiv preprint arXiv:1908.02265. 2019.
[11] Li, L.H., Yatskar, M., Yin, D., Hsieh, C.J., Chang, K.W., “Visualbert: A simple and performant baseline for vision and language” arXiv preprint arXiv:1908.03557. 2019.
[12] Singh, A., Goswami, V., Natarajan, V., Jiang, Y., Chen, X., Shah, M., Rohrbach, M., Batra, D., Parikh, D., “MMF: A multimodal framework for vision and language research”. https://github.com/facebookresearch/mmf. 2020.
[13] Selvaraju, Ramprasaath R., et al. “Grad-cam: Visual explanations from deep networks via gradient-based localization.” Proceedings of the IEEE international conference on computer vision. 2017.